 Authored by TD Markets
Cryptocurrency enthusiasts are always on the lookout for signs that might indicate the arrival of the next bull run. Recently, both Bitcoin (BTC) and Ethereum (ETH), the two most prominent cryptocurrencies, have exhibited bullish price patterns, sparking speculation among investors and traders alike. In this article, we will explore the significance of these patterns and whether they could potentially trigger the next bull run in the crypto market.
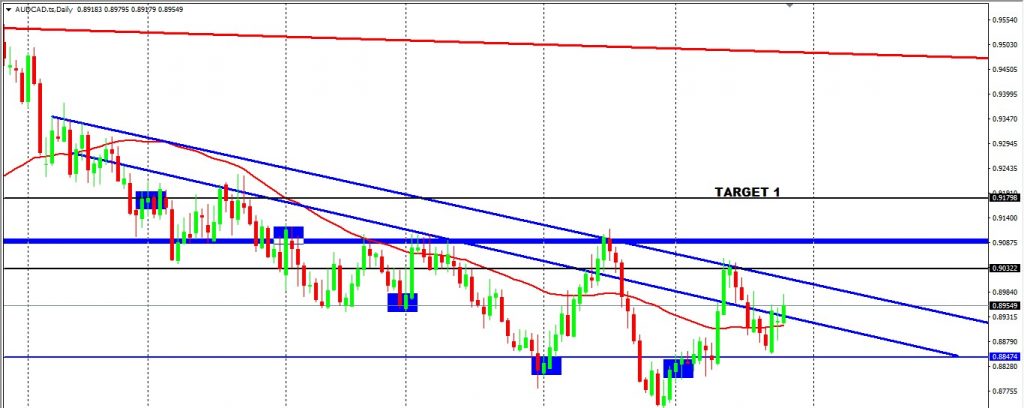
The AUDCAD Performance
The CAD has been dominating the AUD overall, viewed on the monthly time frame. We see both the major inner and outer trends intact. Support has been found at a price point of 0.88474. We look for a short-term buy in the opposite direction of the overall movement. This will be a risky opportunity because going against the dominant trend can result in prices pushing back unexpectedly.
The setup for the buy can be seen on the daily frame, with prices currently trading in between a minor trend. Traders can look for a buy if the minor trend is broken and price point resistance 0.90322 gets a daily close above. The supply and demand zone identified for a later more conservative entry can be taken because the price did push up in the past after it moved past it. Shorter time frames can be considered if the price breaks through the zone.
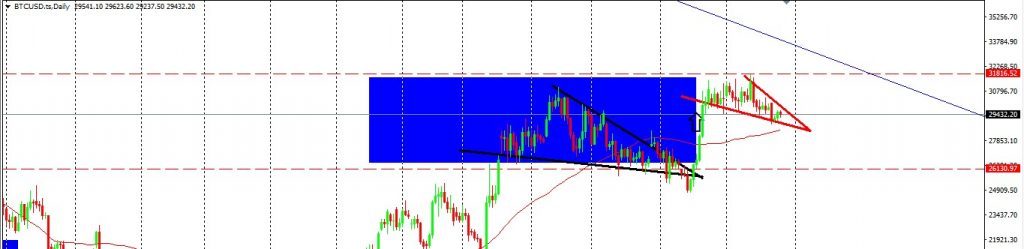
The BTC Performance
Price seems to be setting up the next push now with a falling wedge as it did before. Traders should be aware and monitor the price in the next few days as the breakout can happen unexpectedly.
The price pattern took 5 weeks to form vs the previous breakout that took 12 weeks. Only after 12 weeks could you see the tail on the previous wedge but we are already seeing the tail on the current wedge form. Targets remain the same, we wait for the breakout above 31816.52. The target is set at the same point 42547.38.
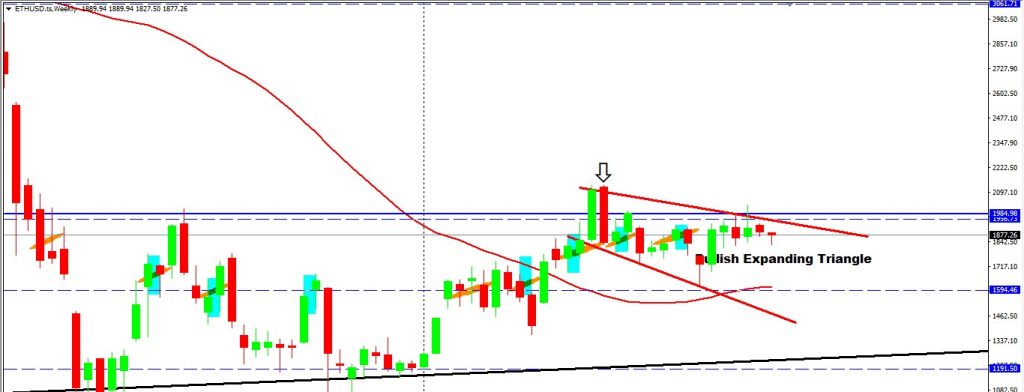
The ETHUSD Performance
Price has been moving in correlation with BTCUSD.
A bullish expanding triangle pattern has formed on the weekly and daily timeframe suggesting the next phase of the uptrend. Price has hovered around the monthly pivot points for a couple of weeks. Traders should monitor both the ETH and BTC together to capitalise on technical correlation. Target remains the same at a price point of 3061.71. The Breakout zone remains intact at the price point of 1984.98.
Read More: Traders Are Bearish On EURCAD
Final Thoughts On Today’s Analysis
The recent bullish price patterns in Bitcoin and ETH have ignited hope for a potential bull run in the cryptocurrency market. However, it is essential to remain vigilant and consider both technical indicators and fundamental factors before making any investment decisions.
The crypto market is known for its unpredictability, and while the signs appear promising, there are no guarantees. As always, conducting thorough research, diversifying your portfolio, and managing risk will be essential strategies for navigating the exciting yet volatile world of cryptocurrencies.