 Authored by TD Markets
In the ever-changing landscape of the financial markets, technical analysis plays a crucial role in identifying potential trading opportunities. Recently, the foreign exchange market witnessed notable developments as the Swiss Franc (CHF) broke out of a descending triangle pattern, while the Canadian Dollar (CAD) appears to have completed its retracement, signalling a potential resurgence in strength. In this article, we'll delve into the significance of these events and explore the implications for traders.
The EURJPY Performance
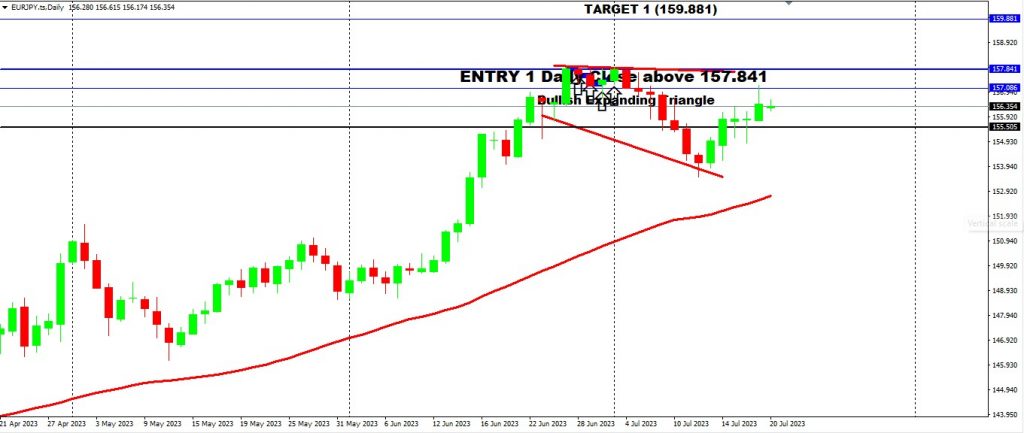
We are still bullish on this pair with a quick update. We are looking for 2 Targets at 159.881 &162.683. Price has formed additional action on the bullish expanding triangle. This is a critical zone because the next formulation will suggest that the setup is not valid.
We look to see whether this opportunity is worth monitoring. If we get a daily candle below 155.505 again, the consideration to cancel the setup will be higher. Traders should monitor it closely this week and be ready to adapt if the situation arises a need for it.
The USCDAD Performance
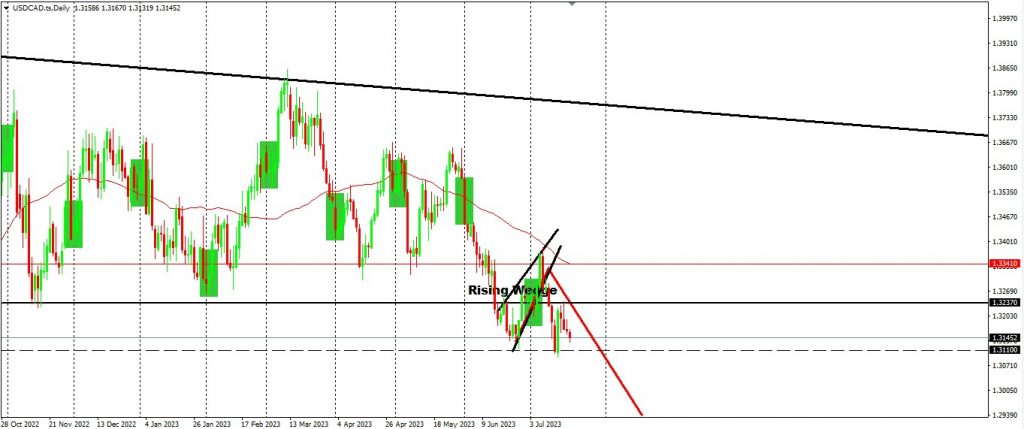
The second round of traders may look to the setup for an opportunity to enter the market, as the retracement has finished according to the daily frame. Additional closes below 1.31100 will give us a higher probability to enter the market. Please monitor it closely by looking for a daily candle close.
The NZDCHF Performance
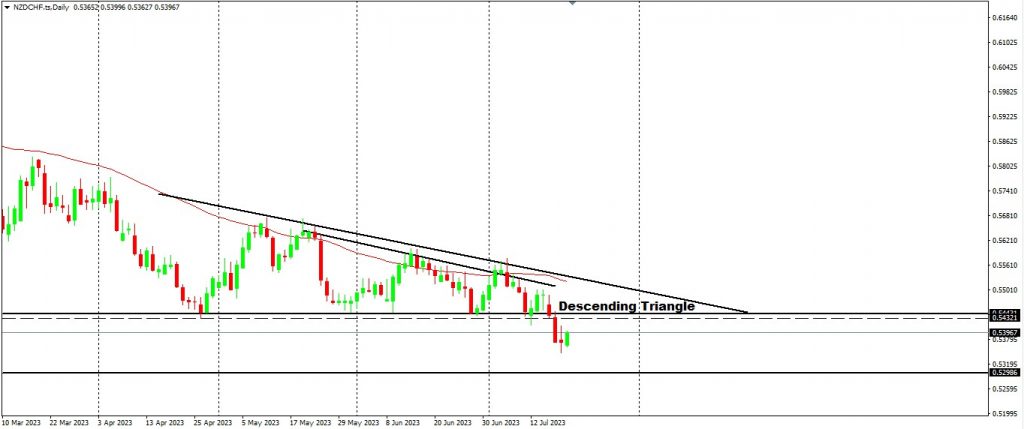
Price has pushed below several annual pivot points and is currently sitting at a support level of 0.54431. Both the Outer Trend and Inner Trend have been respected with prices currently below the inner trend. There is a descending triangle on the daily frame, this has been formulated to suggest more downside and has been broken.
A retracement is currently taking place, giving more traders a chance to get into the market. Watch the resistance now at 0.54431, any momentum timeframes that close above should be considered a pause and a higher risk to enter. We expect to resist and come back again to reach target 0.52986.
Read More: 10 Essential Candlestick Patterns Traders Should Know
Final Thoughts On Today’s Analysis
In conclusion, recent developments in the forex market have provided traders and investors with valuable insights into potential trading opportunities. The CHF breakout from a descending triangle hints at a potential bullish trend reversal, while the CAD appears to have completed its retracement, signalling a resumption of its strength. Check our YouTube channel to learn more about our analysis.