 Authored by TD Markets
As the financial markets continue to evolve, traders are always on the lookout for potential opportunities to profit. Two assets that have recently caught the attention of many traders are the U.S. Dollar Index (DXY) and Natural Gas (NGAS). With both assets exhibiting interesting price patterns and market dynamics, traders are keenly observing them for potential short-term strength and price movements.
The DXY (DOLLAR INDEX) Performance
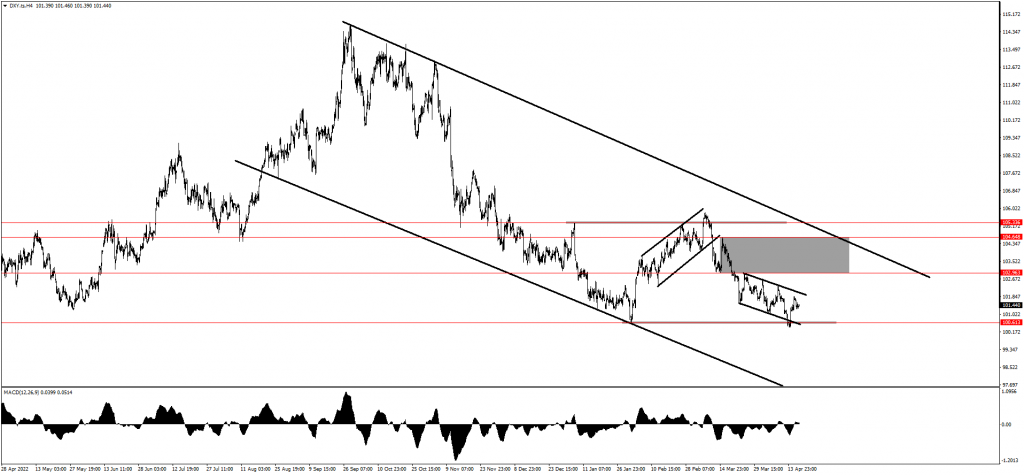
Possible retracement on the DXY?
The DXY recently bounced from the previous structure low of around 100.600. This zone is aligned with the lows of the descending structure which added to the confluence and made a push to the upside possible. This price action was further confirmed by the MACD as momentum to the downside is slowing down. According to this price action, traders are observing the DXY and a possible retracement which will cause the market to break above the descending channel and rally up to the supply zone.
The EURUSD Performance
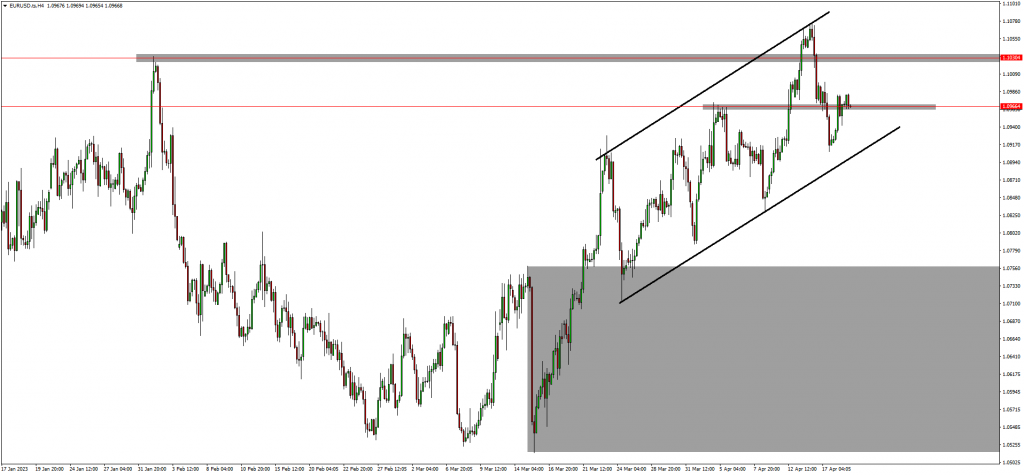
Inverse correlation to the DXY.
EURUSD previously broke above the previous structure high around 1.10300 however it did not continue to the upside and aggressively dropped. This was also due to the highs of the ascending structure. Traders are using the DXY as a leading indicator to EURUSD; a break above the channel on the DXY will indicate strength on the USD and cause EURUSD to break below the ascending channel.
As such, traders will look for short-term trading opportunities to the downside with targets at the demand zone.
The NGAS (Natural Gas) Performance
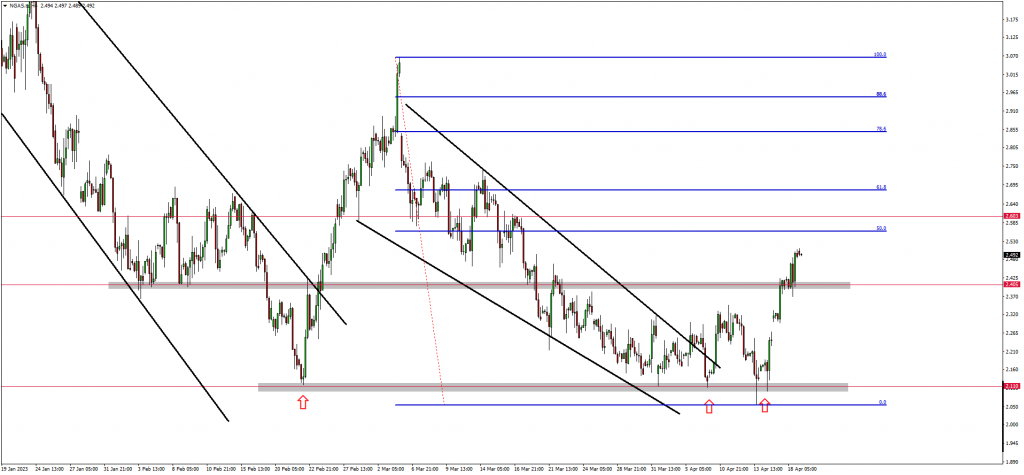
(UPDATE) - NGAS strength continues.
NGAS aggressively broke and closed above the $2.40 price level on the daily timeframe and breaking above the previous high. This price action further confirms that the bulls are still in control. Traders anticipate a retracement with the possibilities of a retest on this support zone before looking for trading opportunities with targets set at $2.50 or $2.60.
Final thoughts on today's analysis
In conclusion, traders are closely observing the U.S. Dollar Index (DXY) and Natural Gas (NGAS) for potential short-term strength and price movements. Factors such as expectations of rising interest rates and tightening supply-demand dynamics are driving the bullish sentiment around these assets.
Traders are using technical analysis and chart patterns to identify potential trading opportunities and capitalize on potential price movements. Looking for a broker you can trust? Reach out to Africa's Most Trusted broker today at care@tdmarkets.com