 Authored by TD Markets
The NAS100 and US30 indices are currently exhibiting strong bullish momentum, suggesting a positive outlook for investors. These two prominent market indicators, which represent the performance of the top 100 and top 30 publicly traded companies in the US respectively, have been steadily climbing in recent weeks, indicating robust market conditions.
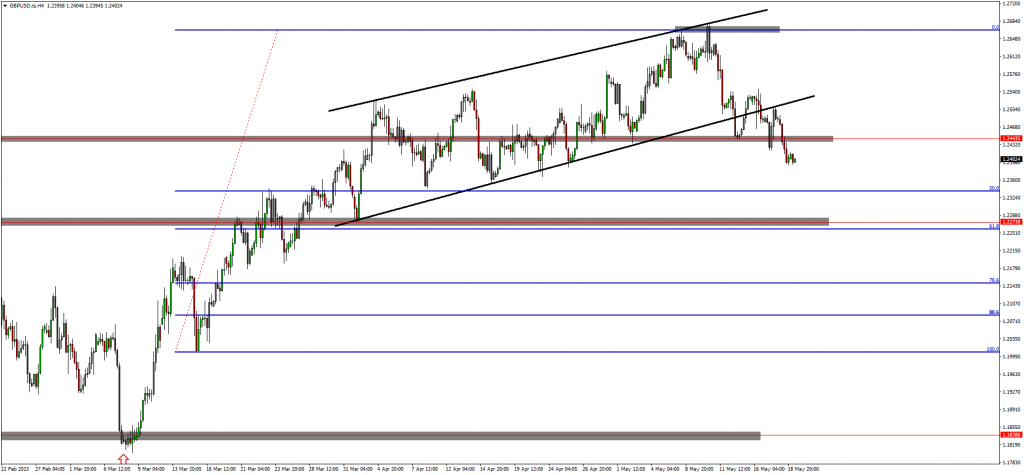
The GBPUSD Performance
(UPDATE) - GBPUSD dropped +70 pips
GBPUSD has broken below the support zone around 1.24430 and is likely going to create a lower low. This price action indicates bearish momentum and a retest of the broken structure could see a continuation to the downside. As such, traders have targets set around the 50.0 fib level.
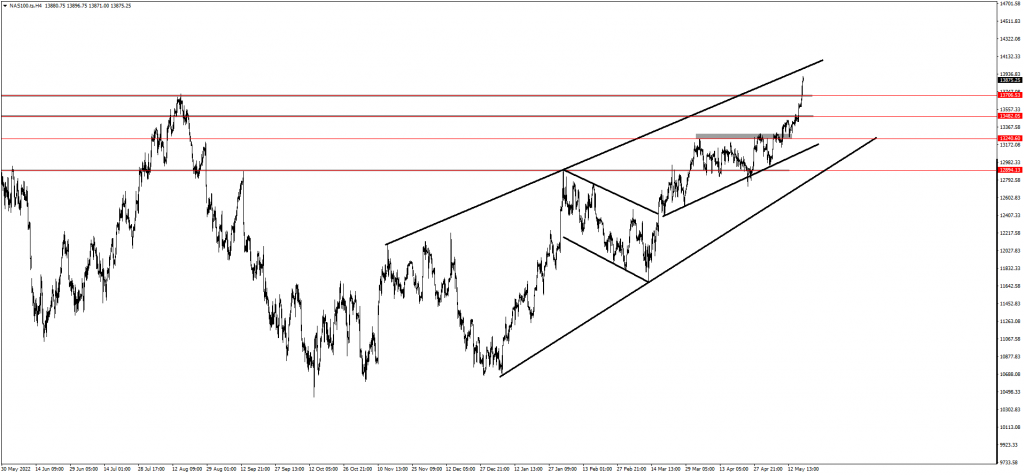
The NAS100 Performance
(UPDATE) - NAS100 is trading above the weekly timeframe lower high.
NAS100 has broken above the second target and the weekly timeframe structure is around 13700.00. It is also close to the top of the ascending structure. According to the weekly timeframe's structure, the market could be set for a reversal of the overall trend to the upside since the market structure has been broken. Traders will keep an eye on how the market reacts to the recent price action and wait for more price action to indicate the next move.
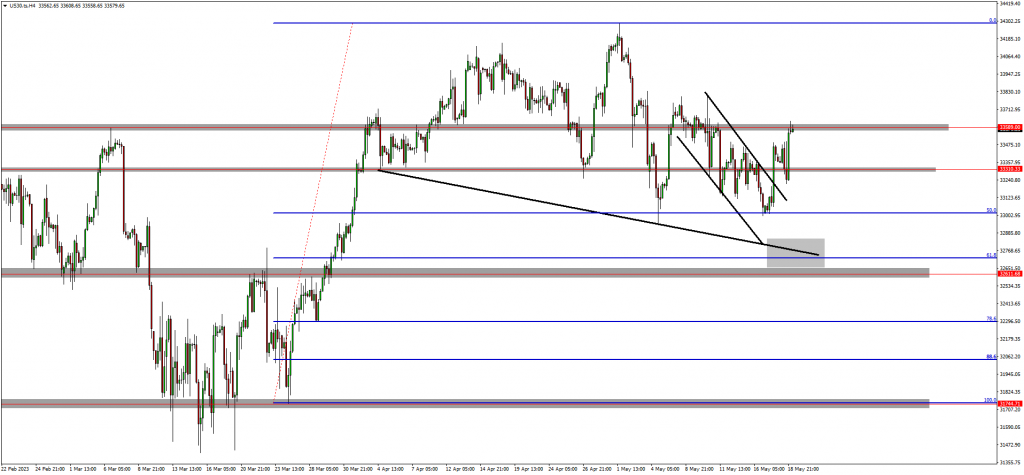
The US30 Performance
(UPDATE) - US30 has rallied up to the resistance zone around 33589.00.
The recent price action on US30 indicates that the bullish trend is about to resume as the market has aggressively pushed up to the resistance zone around 33589.00. This further confirms a break above the descending structure as well as the previous support zone around 33310.00.
Traders are still bullish according to the daily and the weekly timeframe's bullish structure and are waiting for a break and close above the resistance zone before looking for trading opportunities.
Final thoughts on today’s analysis
In conclusion, the NAS100 and US30 indices are currently displaying bullish momentum, indicating a positive outlook for investors. The technology-focused NAS100 and the diverse US30 have both experienced upward trends, propelled by factors such as economic recovery, accommodative monetary policies, and ongoing innovation. Nonetheless, investors should exercise caution and engage in prudent investing practices to navigate potential market fluctuations.