 Authored by TD Markets
The NAS100 Performance
NAS100 aggressively broke above the channel and is trading within the outer descending channel. Recently the market bounced from the bottom of the channel and pushed to the upside which saw an aggressive break above the inner channel as well as the resistance zone around 14481.00. This price action indicates that there's bullish momentum in the market and as such, traders are waiting for a retracement before looking for trading opportunities to the upside.

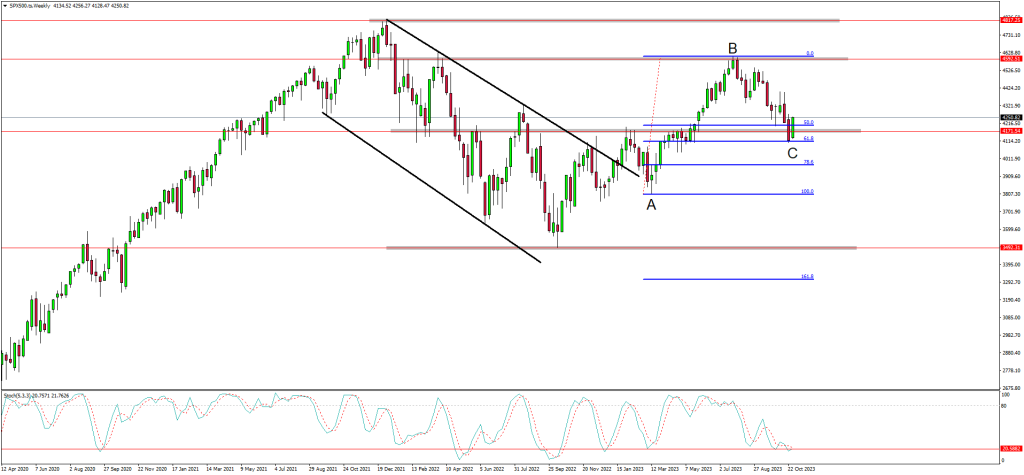
The SPX500 Performance
SPX500 is about to complete the retracement and is currently trading within the retracement and is bouncing from the support zone around 4171.00.This comes after the market aggressively pushed up from point A broke above the resistance zone and created a higher high at point B. The Fibonacci retracement tool indicates that the market has retracement about 50% of the impulse wave and as such traders anticipate the trend to resume to the upside. According to this price action, traders are looking for trading opportunities with targets set at point B.
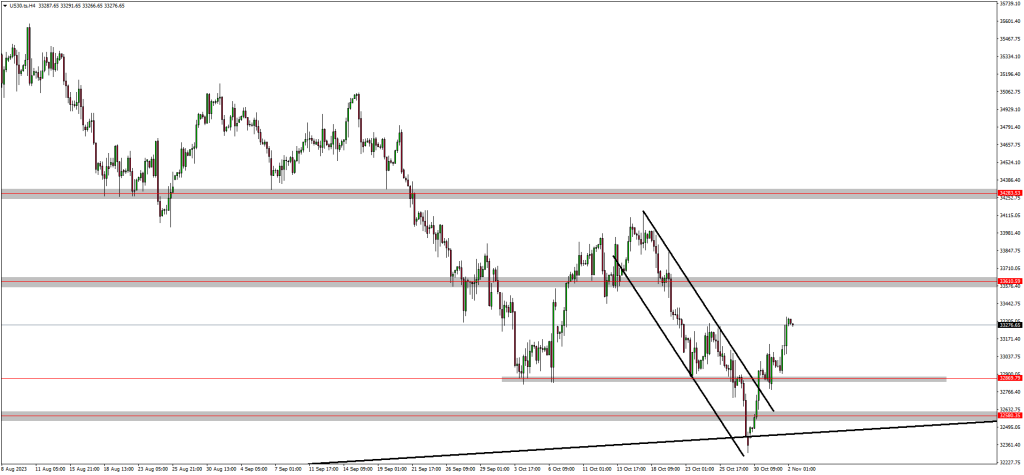
The US30 Performance
US30 is now trading above the channel and has recently created a lower low around 32361.10 and ultimately bounced from the support zone around 32580.00 and started to rally to the upside. This price action caused the market to break above the channel as well as the previous resistance zone around 32869.00.Traders are now bullish according to this price action and are looking for trading opportunities up to the resistance zone around 33610.00.
Final Thoughts On Today's Analysis
In conclusion, the recent price action analysis of the US indices, including NAS100, SPX500, and US30, indicates a strong bullish sentiment among traders. NAS100 broke above both the inner and outer descending channels, signaling significant bullish momentum. Traders are waiting for a retracement before considering long positions. Similarly, SPX500 completed a retracement, bouncing from a support zone after creating a higher high. Traders are anticipating the upward trend to resume and are eyeing trading opportunities with targets set at the recent high point. US30 rallied after bouncing from a support zone, breaking above the channel and a previous resistance zone. This led traders to adopt a bullish outlook, seeking trading opportunities towards the next resistance zone. Overall, the analysis suggests that traders are optimistic about the US indices, expecting further upward movement in the market. Subscribe to our YouTube channel today to learn more.